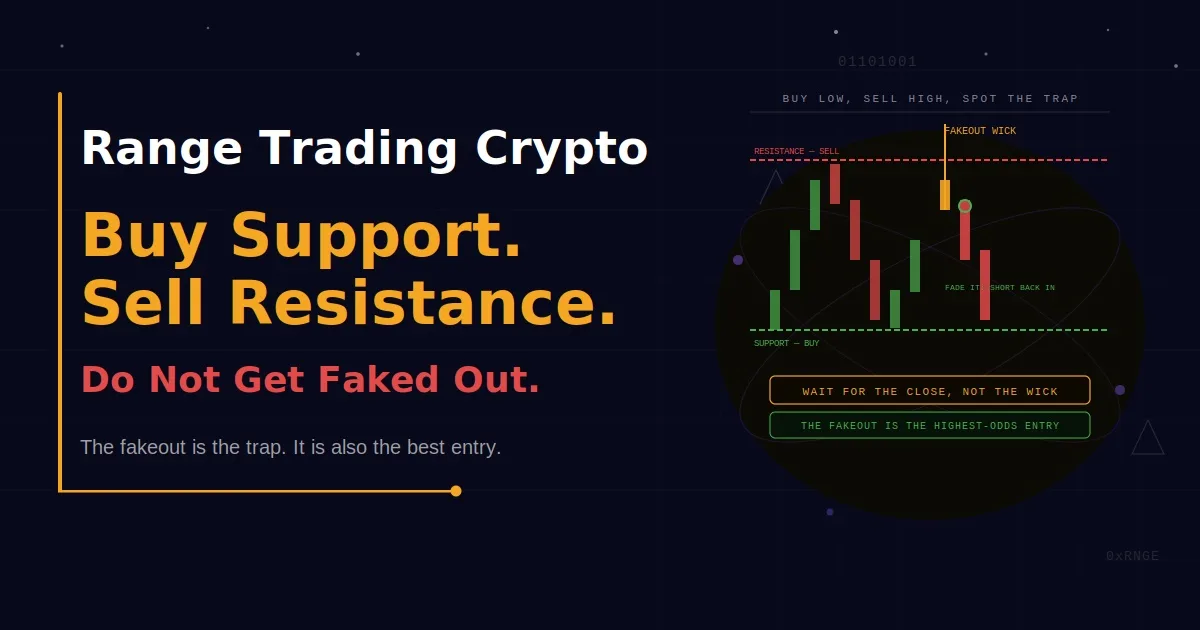
A mean reversion strategy wins often but fails hard in trends. Learn the exact RSI, Bollinger Band, and ADX rules that define when it works.
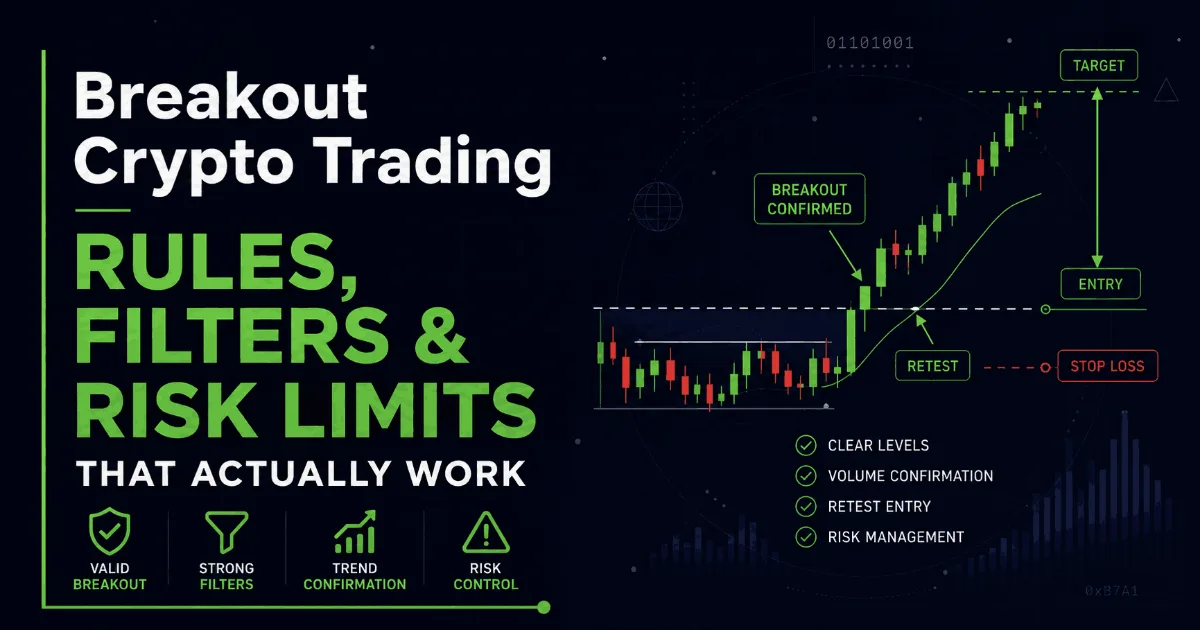
A breakout crypto strategy is only as good as its filters. Learn the exact rules for a valid entry, how to spot false breakouts, and how to size risk.
Liquidation cascades are why crypto moves in violent trend days and long wicks. Learn how forced selling snowballs, why it happens, and how to read the terrain.
All information on this site is provided by Mubite for educational purposes only, specifically related to financial market trading. It is not intended as an investment recommendation, business advice, investment opportunity analysis, or any form of general guidance on trading investment instruments. Trading in financial markets involves significant risk, and you should not invest more than you can afford to lose. Mubite does not offer any investment services as defined under the Capital Market Undertakings Act No. 256/2004 Coll. The content on this site is not directed toward residents in any country or jurisdiction where such information or use would violate local laws or regulations. Mubite is not a brokerage and does not accept deposits. All trading accounts provided by Mubite are simulated demo accounts using live market data. No client funds are traded on live markets. Payout figures shown are individual results and are not typical. Past performance does not guarantee future results.
Mubite s.r.o., Školská 660/3, Nové Město, ICO: 23221551 Praha 1, 110 00, Czech Republic | Copyright Ⓒ 2026 Mubite. All Rights Reserved.

A complete trend following crypto guide. Learn the exact entry methods, exit rules, and filters that keep you in strong trends.
Trend following is the strategy behind almost every large trading gain in crypto history. It does not try to predict tops or bottoms. It identifies a trend that is already underway, enters in its direction, and holds until the trend shows real signs of ending.
It also has a psychological profile most traders cannot handle: a win rate around 30 to 40 percent, offset by a small number of very large winners that carry the whole system. You lose more often than you win, and you still come out ahead, but only if you follow the rules precisely. This guide covers the entries, exits, and filters that make that possible.
Trend following enters in the direction of an established trend and holds until it reverses
Win rate is typically 30 to 40 percent, profitability comes from letting winners run far larger than losers
Identify the trend with moving averages, higher highs and higher lows, and ADX above 25
Enter on pullbacks, breakouts, or moving average crossovers
Exit with a trailing stop, a moving average cross back, or a break of trend structure
The strategy dies in ranging markets, filters are what keep you out of the chop
Trend following is a strategy built on one observation: crypto moves in sustained directional trends more often, and further, than most traders expect. Instead of guessing where a move begins, you wait for confirmation that a trend exists, then ride it.
The defining trait is the payoff structure. Trend following wins only 30 to 40 percent of the time, because trends are interrupted by frequent pullbacks and false starts. What makes it profitable is the size of the winners. A single trend that runs for weeks can pay for a long series of small losing trades. The April 2020 golden cross, when Bitcoin's 50-day moving average crossed above its 200-day, preceded a run from roughly $7,000 to $64,000 over the following year. One trend captured, dozens of small losses covered.
This is the opposite of a mean reversion strategy, which wins often with small gains and fails in trends. Trend following wins rarely with large gains and fails in ranges. Knowing which regime you are in decides which tool to use.
Before entering, you need objective confirmation that a trend actually exists. Three tools do this.
Moving averages – Price above a rising 200-period moving average is an uptrend, below a falling one is a downtrend. The 50-day and 200-day are the standard reference pair for the larger trend
Market structure – An uptrend prints higher highs and higher lows, a downtrend prints lower highs and lower lows. When that structure breaks, the trend is in question
ADX – The Average Directional Index measures trend strength. ADX above 25 confirms a real trend worth following, below 20 warns the market is ranging and trend signals will fail
The mistake beginners make is trading trend setups without confirming a trend is present. ADX above 25 combined with clear higher highs and higher lows is the green light. Without it, you are trading noise.
The moving average crossover strategy is the most widely used trend following entry, because it turns trend direction into a clear, mechanical signal.
It works with two moving averages, a faster one and a slower one:
Golden cross: the faster MA crosses above the slower MA, signaling a potential uptrend entry. The classic version is the 50-day crossing above the 200-day
Death cross: the faster MA crosses below the slower MA, signaling a potential downtrend or exit. The 50-day crossing below the 200-day is the classic bearish signal
For shorter timeframes, the 20-period and 50-period EMA crossover on a 4-hour chart is a common intraday version. When the 20 EMA crosses above the 50 EMA, trend traders enter long and hold as long as price stays above both. The position closes when the 20 crosses back below the 50.
The strength of the crossover is its objectivity, there is no guessing. The weakness is lag. Moving averages are lagging indicators, so a crossover confirms a trend after it has already started, and produces false signals in choppy, sideways markets. This is exactly why the ADX filter matters, it keeps you from acting on crossovers when no real trend is present.
Beyond the crossover, trend followers use two other proven entries. All three share one principle: wait for confirmation rather than predicting the trend's start.
Pullback entry. In an established uptrend, wait for price to pull back to a moving average or trendline, then enter as it resumes. This gives a better entry price and a tighter stop than chasing. The 20 EMA and 50 EMA often act as dynamic support in strong trends
Breakout entry. Enter as price breaks above a key resistance level with a volume spike, signaling trend continuation or a new trend. This overlaps with a dedicated breakout strategy, where the volume filter and retest entry are covered in full
Crossover entry. The moving average crossover described above
Each entry needs the same confirmation: the trend filter has to be green first. A pullback in a downtrend is not a trend following long, it is a falling knife.
Exits matter more in trend following than in any other strategy, because the entire edge depends on letting winners run while cutting losers fast. Three exit methods do this.
Trailing stop – A stop that follows price at a fixed distance, locking in profit as the trend extends while staying out of the way. Enter SOL at $100 with a 10 percent trailing stop, and if price rises to $150 the stop moves to $135, protecting gains while the trend continues. An ATR-based trailing stop adapts the distance to volatility
Moving average cross back – Exit when the faster MA crosses back below the slower one, the death cross of your entry pair. This keeps you in for the full trend and out before deeper corrections
Trend structure break – Exit when price closes below the latest swing low in an uptrend, or above the latest swing high in a downtrend, on meaningful volume. A structural break is an exit signal, not an invitation to average down
The common thread: never exit a winning trend trade early out of fear, and never hold a losing one hoping it turns into a trend. The trailing stop enforces both.
This is where most trend followers fail. Trend following is highly profitable in trending markets and bleeds money in ranging ones, where crossovers whipsaw and every breakout reverses. The filters below keep you out of those conditions.
ADX above 25. The single most important filter. If ADX is below 20, the market is ranging and trend signals will fail. Stand aside
Volume confirmation. Breakouts and crossovers on weak volume frequently fail. Require a volume spike to confirm participation behind the move
Multiple timeframe alignment. Confirm the trend on a higher timeframe before entering on a lower one. A 4-hour long is far safer when the daily is also trending up
Avoid low-volatility ranges. When price oscillates around a flat moving average with contracting ATR, trend following is the wrong tool. This is when a mean reversion approach fits instead
Getting the regime right is the whole game. A trend follower who only trades when ADX confirms a trend avoids the majority of the losing whipsaw trades that make beginners abandon the strategy.
Trend following carries a specific risk that traders underestimate: trends include pullbacks, and a pullback can liquidate an over-leveraged position before the trend resumes and proves you right.
The math is direct. At 5x leverage, price needs to move roughly 20 percent against you to hit liquidation. At 20x, that gap shrinks to about 5 percent, well within a normal trend pullback. This is why trend following works best with low leverage, typically 2x to 5x. Lower leverage gives the trade room to breathe through the retracements that are a normal part of any trend.
For funded traders the point is sharper. A trend following strategy with a 30 to 40 percent win rate produces losing streaks by design, five or six small losses in a row while waiting for the trend that pays for them all. Fixed position sizing of 1 to 2 percent per trade is what keeps those streaks inside a drawdown limit.
Understanding risk to reward matters here more than raw win rate, because the strategy's entire profitability comes from the large payoff ratio, not from being right often.
Trading trends in a range. The biggest error, taking crossover and breakout signals when ADX shows no trend
Exiting winners early. Cutting a winning trend trade at the first pullback destroys the large winners the strategy depends on
Over-leveraging. High leverage liquidates you on a normal pullback before the trend resumes
Averaging down on a structure break. A trend break is an exit, not a discount to buy more
Ignoring the higher timeframe. Entering against the larger trend is how good setups turn into losses
Yes, crypto's tendency toward extended directional moves in both bull and bear markets suits trend following well. It performs best in clearly trending, higher-volatility conditions and loses money in sideways ranges, so a trend filter like ADX is essential.
A golden cross occurs when a faster moving average crosses above a slower one, such as the 50-day above the 200-day, signaling a potential uptrend. A death cross is the reverse, the faster MA crossing below the slower, signaling a potential downtrend or exit.
Share it with your community